Click Here to Go Back to Fudan Course
Exercise for Day 1: Digital Archives: Preservation and Access
- Visit Slave Societies Digital Archive. What is the project’s mission? How does it go about this?
- Visit SlaveBiographies. What is the project’s mission? How does it go about this?
- Download Tropy and open and account (if you can). Note that Tropy is an open source program for organizing and cataloging images from archives or elsewhere.
- https://tropy.org/
- Tropy user guide
- Tropy PowerPoint (includes information on Zotero, https://www.zotero.org/ )
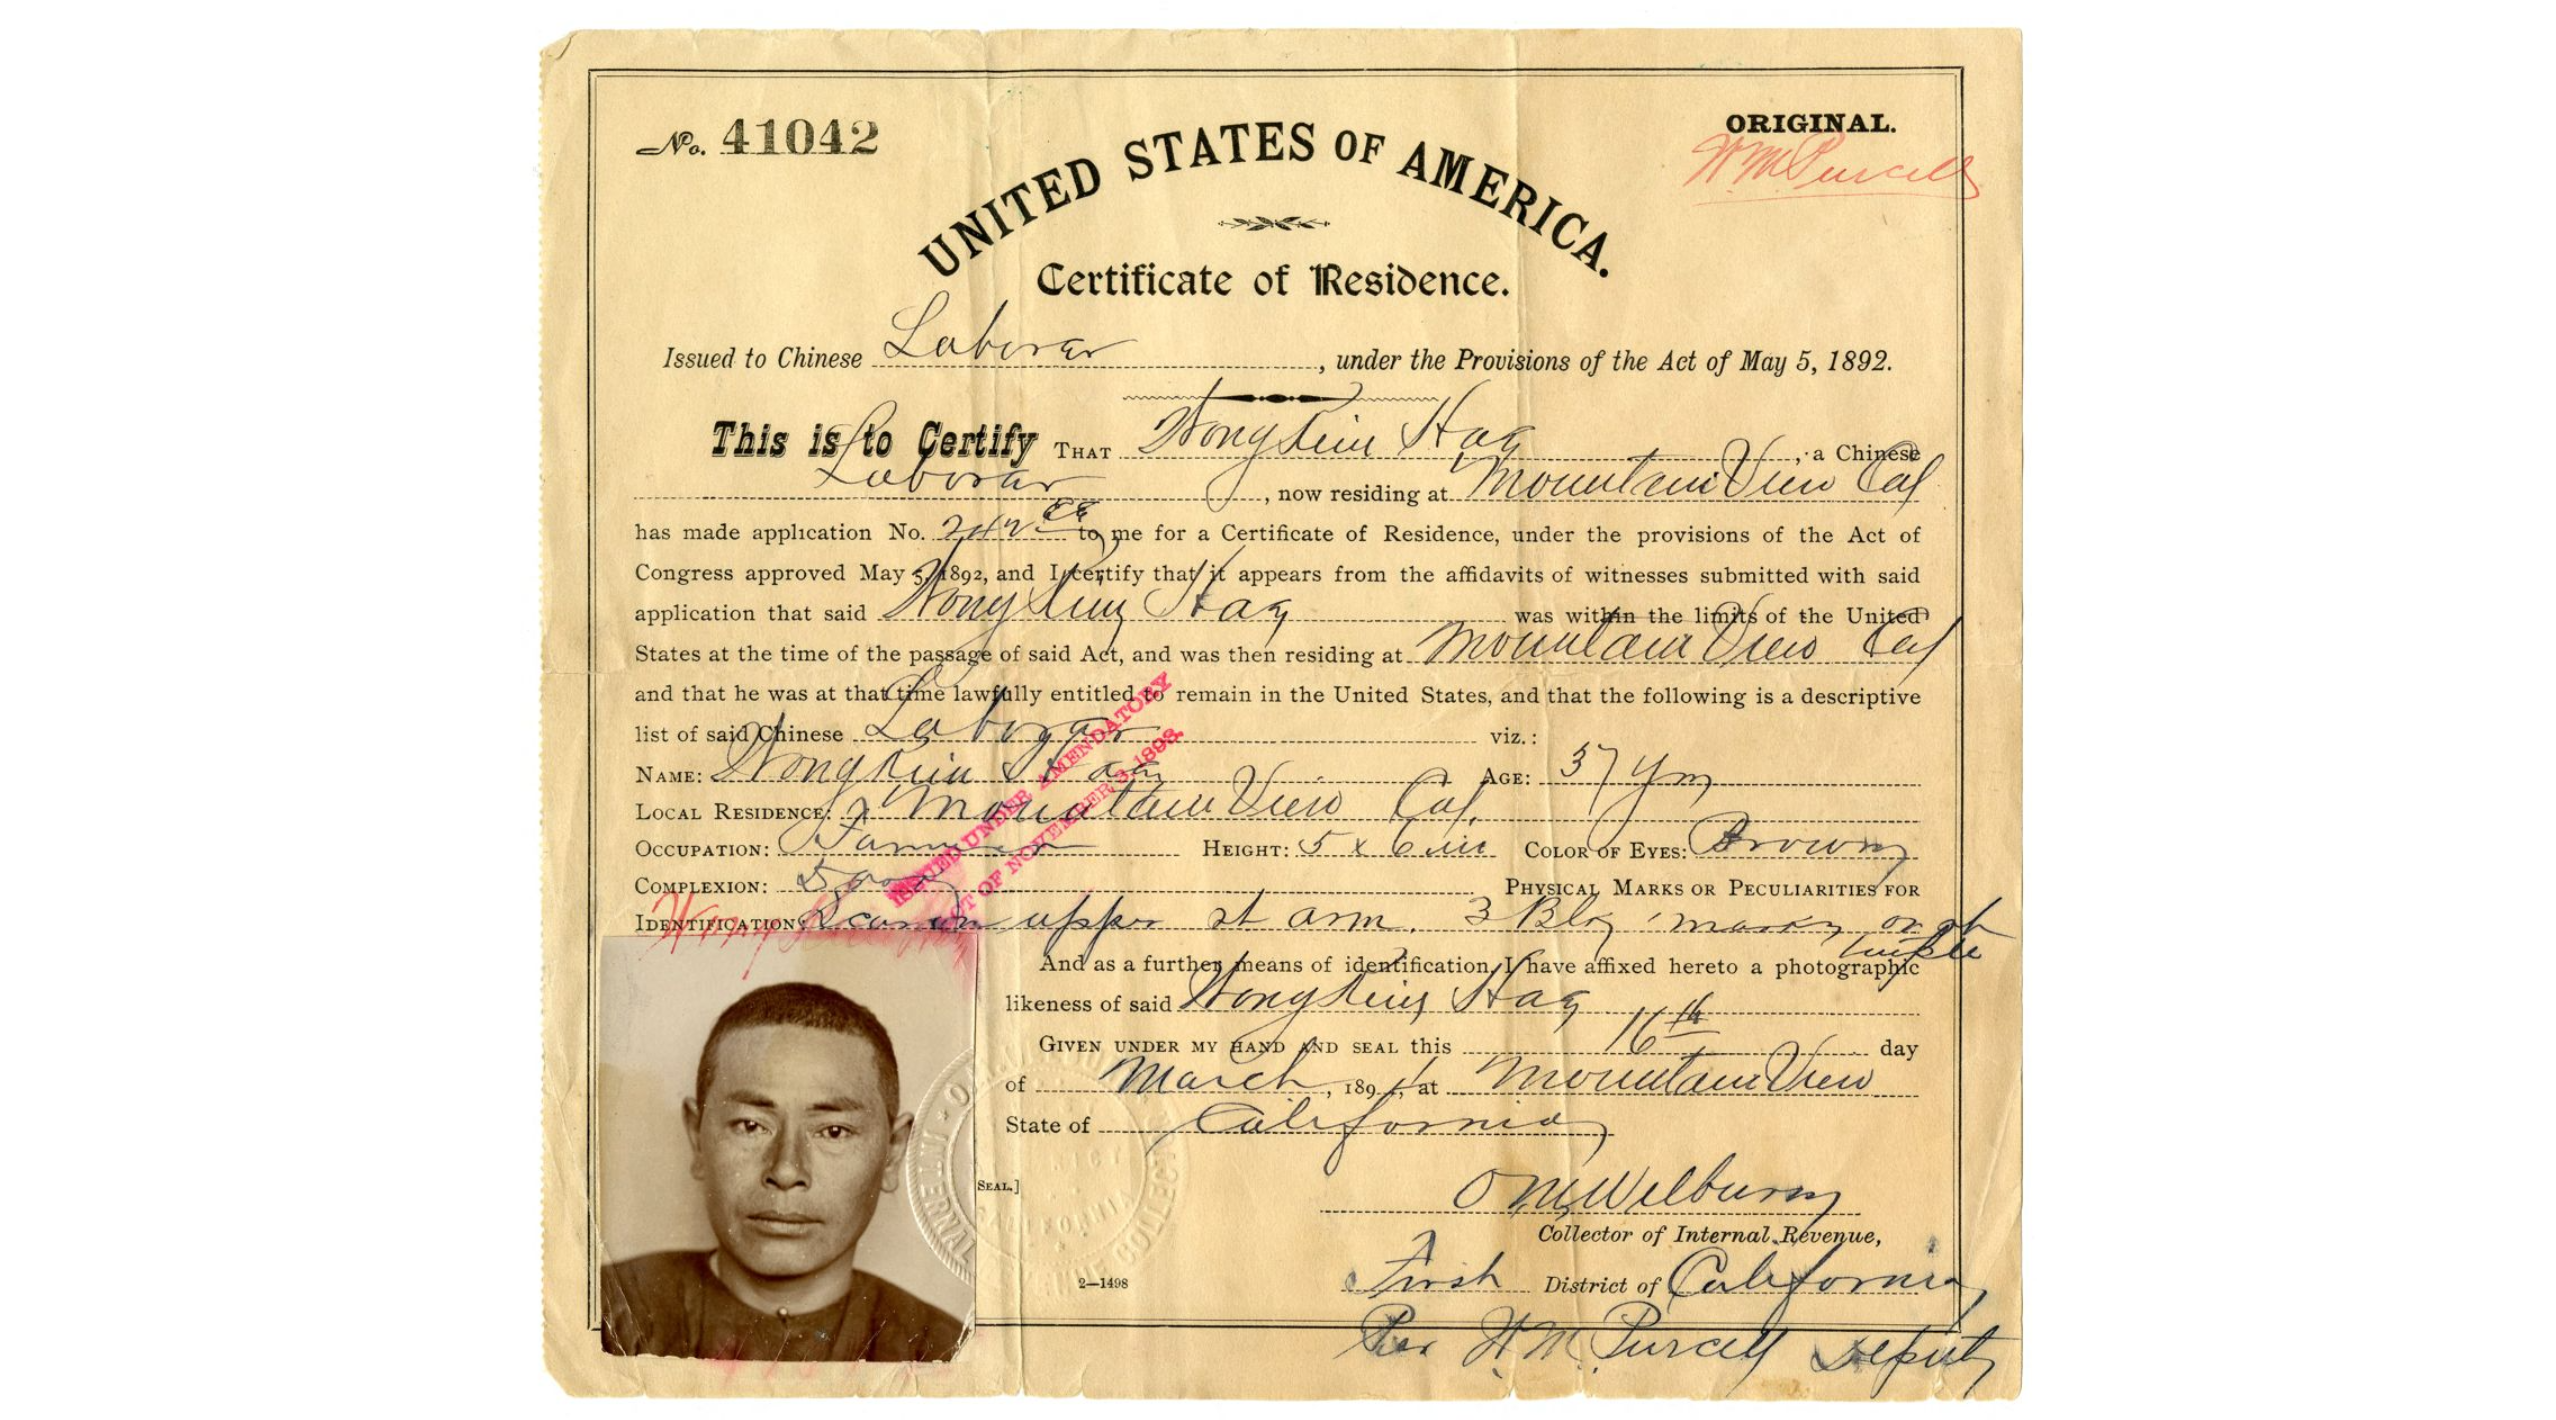
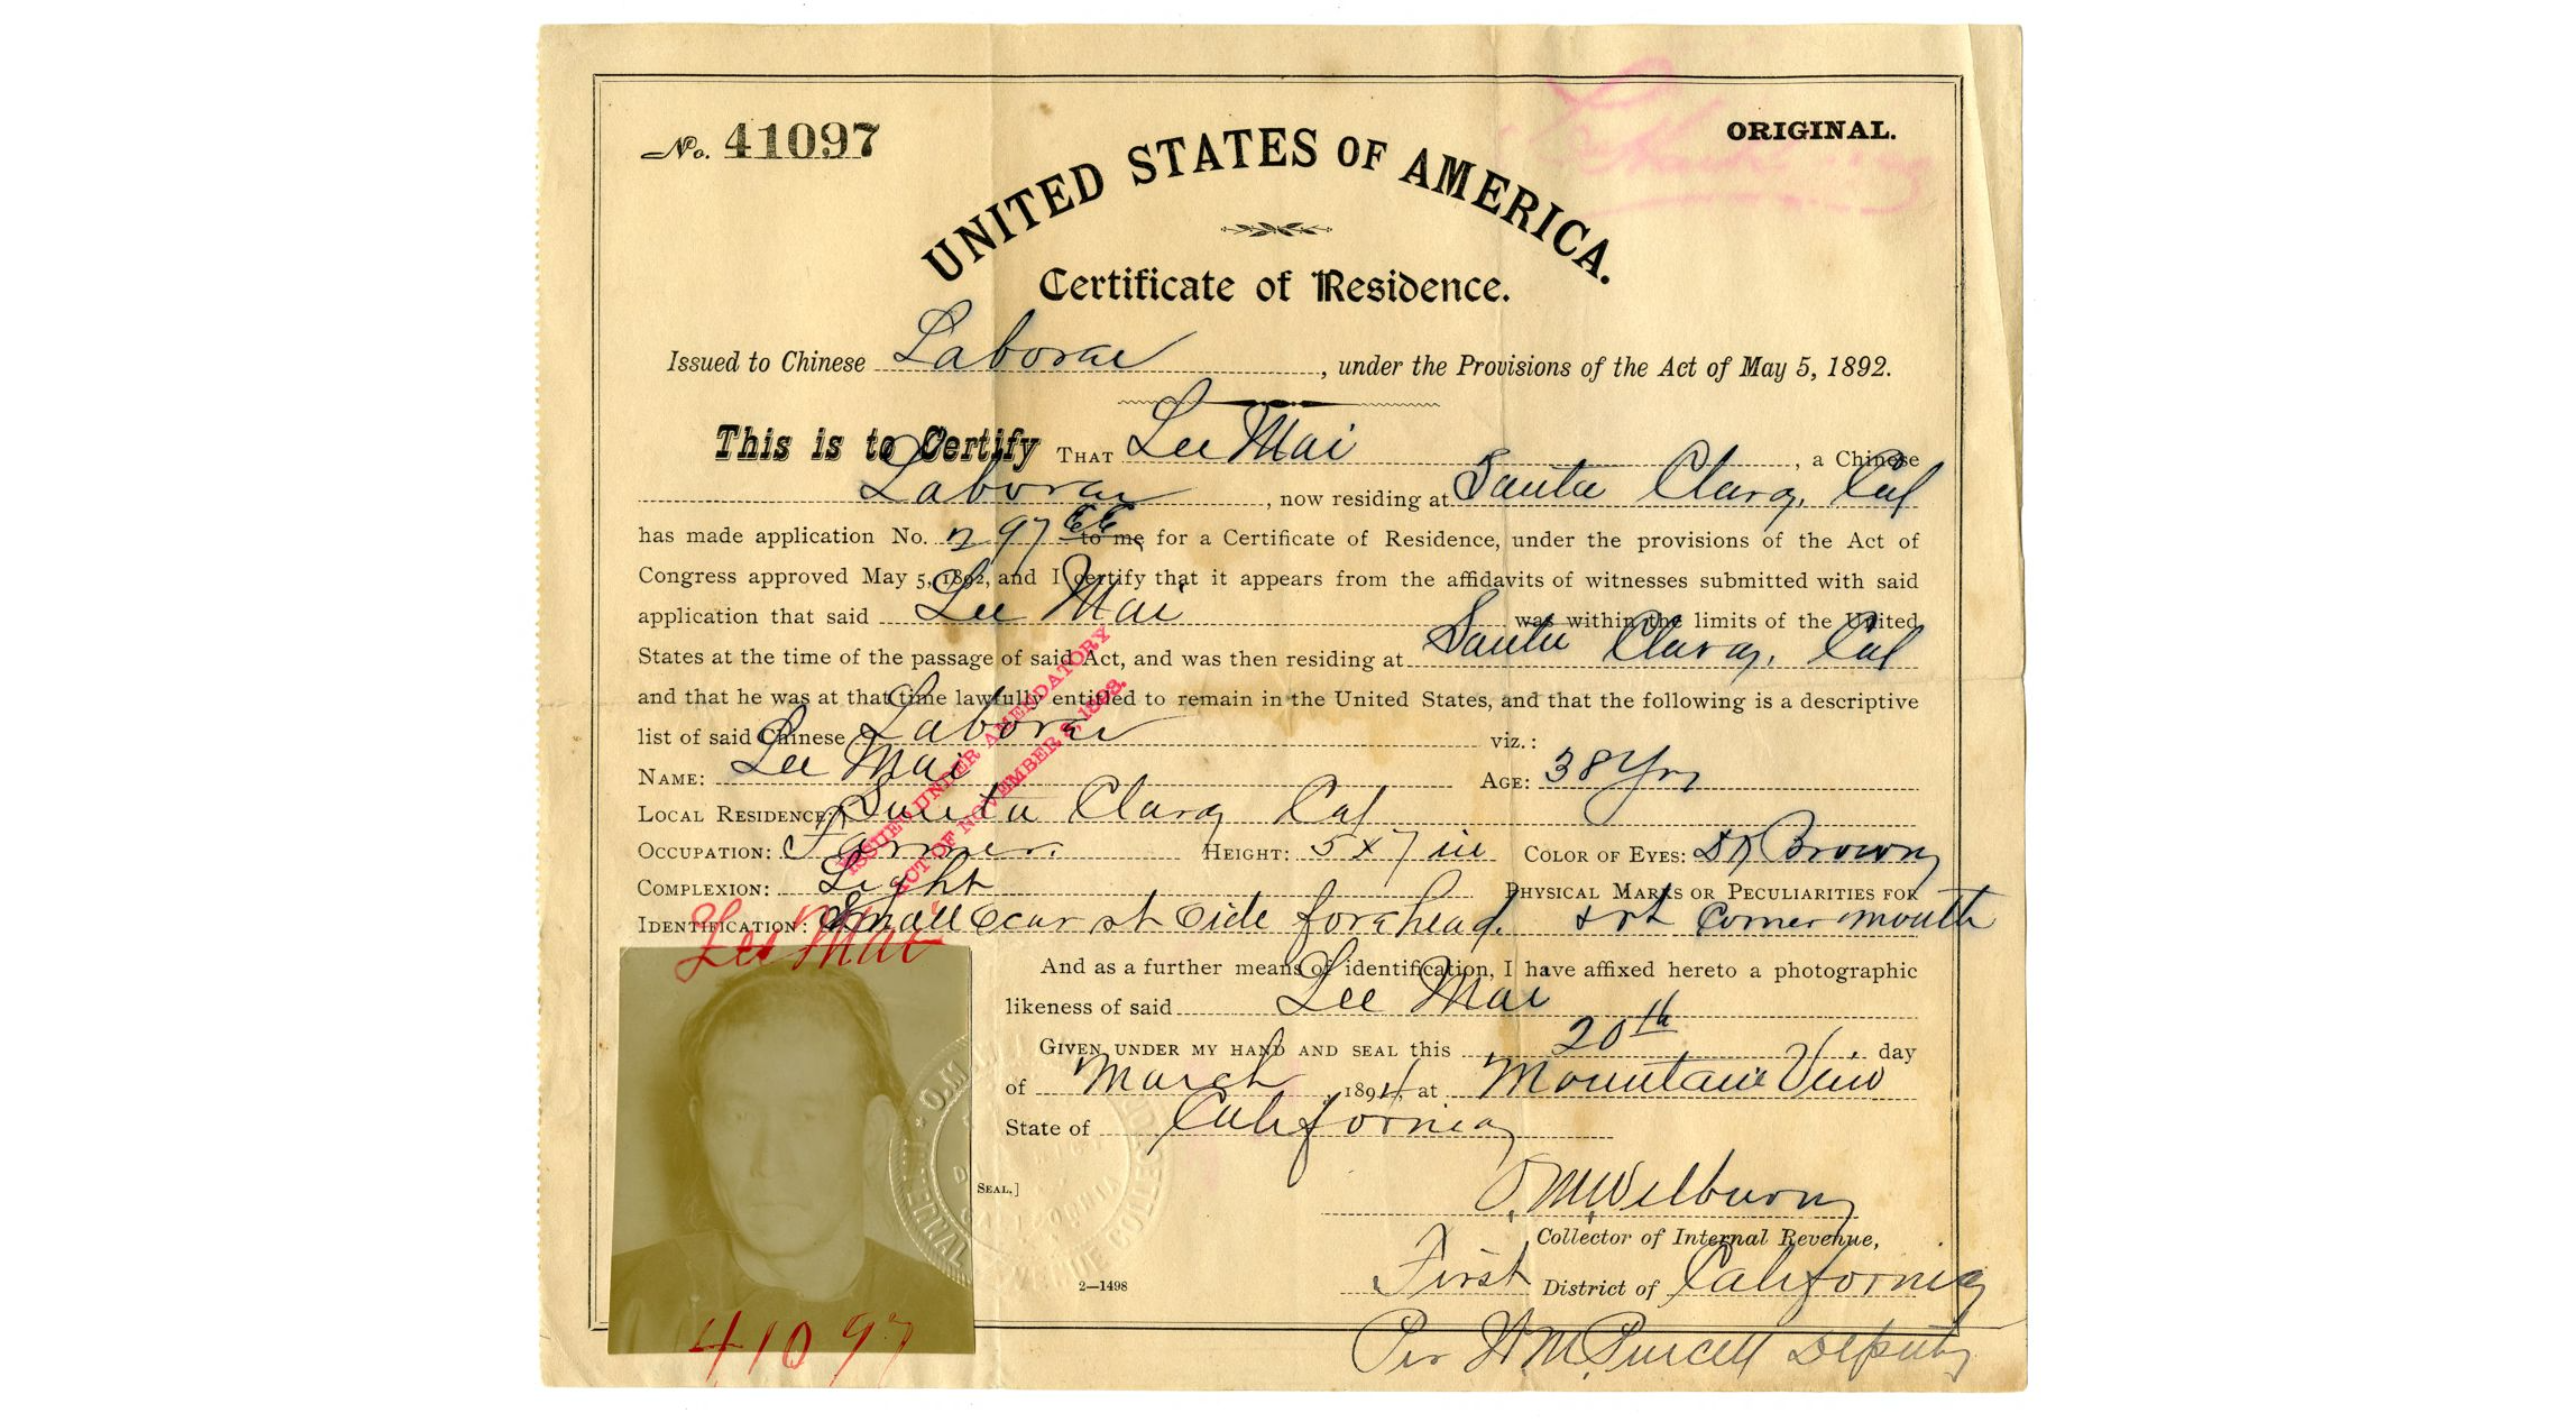
- I will walk you through how to digitize documents and objects and enter metadata in Tropy. For the exercise, pretend you digitized documents in a collection of Certificates of Residence for Chinese in the United States in the late nineteenth and early twentieth centuries. Under the provisions of the 1892 Geary Act, which amended the Chinese Exclusion Act of 1882, all Chinese in the United States were required to apply for, obtain, and carry a government-issued certificate of residence proving their legal presence in the United States. Chinese and Chinese Americans discovered without such identification could be arrested and deported. Enter the images into Tropy and enter metadata for each image. See the collection here: https://digitallibrary.californiahistoricalsociety.org/object/2625?solr_nav%5Bid%5D=0153503c8613a8d43d58&solr_nav%5Bpage%5D=0&solr_nav%5Boffset%5D=0 . Or see thee of the files here:
- If there is time, we can begin a datasetting exercise with the documents you have attached metadata to in Tropy.
Exercise for Day 2: SlaveVoyages
- Visit SlaveVoyages: https://www.slavevoyages.org/
- On the main page, click Trans-Atlantic>Estimates
- On the page that is displayed, figure out how to estimate over 50-year periods how many enslaved people were embarked in African regions and how many were disembarked in European and American regions.
- Choose a region of embarkation and a region of disembarkation and record the figures for each 50-year period
- Determine the region of Africa that embarked the most enslaved people.
- Determine the region of the Americas in which the largest number of enslaved people were disembarked
- Was the Mainland North America (the present-day United States) the largest region of disembarkation?
- Return to main page, click Trans-Atlantic>Database
- At top of the page click Itinerary>Place where captives were purchased>Principal place where captives were purchased>Africa>(select a region)>Apply>on page that is displayed at top click Summary Statistics. Write down the results for the region where captives were purchased
- Return to main page, click Trans-Atlantic>Database
- At top of the page click Itinerary>Place where captives were purchased>Principal place where captives were landed>Africa>(select a region)>(select a port)>Apply>on page that is displayed at top click Summary Statistics. Write down the results for the port where captives were purchased
- On that page click on a ship. Write down the ship’s name and some details about it.
- On the main page, click Trans-Atlantic>Estimates
Exercise for Day 3: Datasetting
- Open Excel on your laptop.
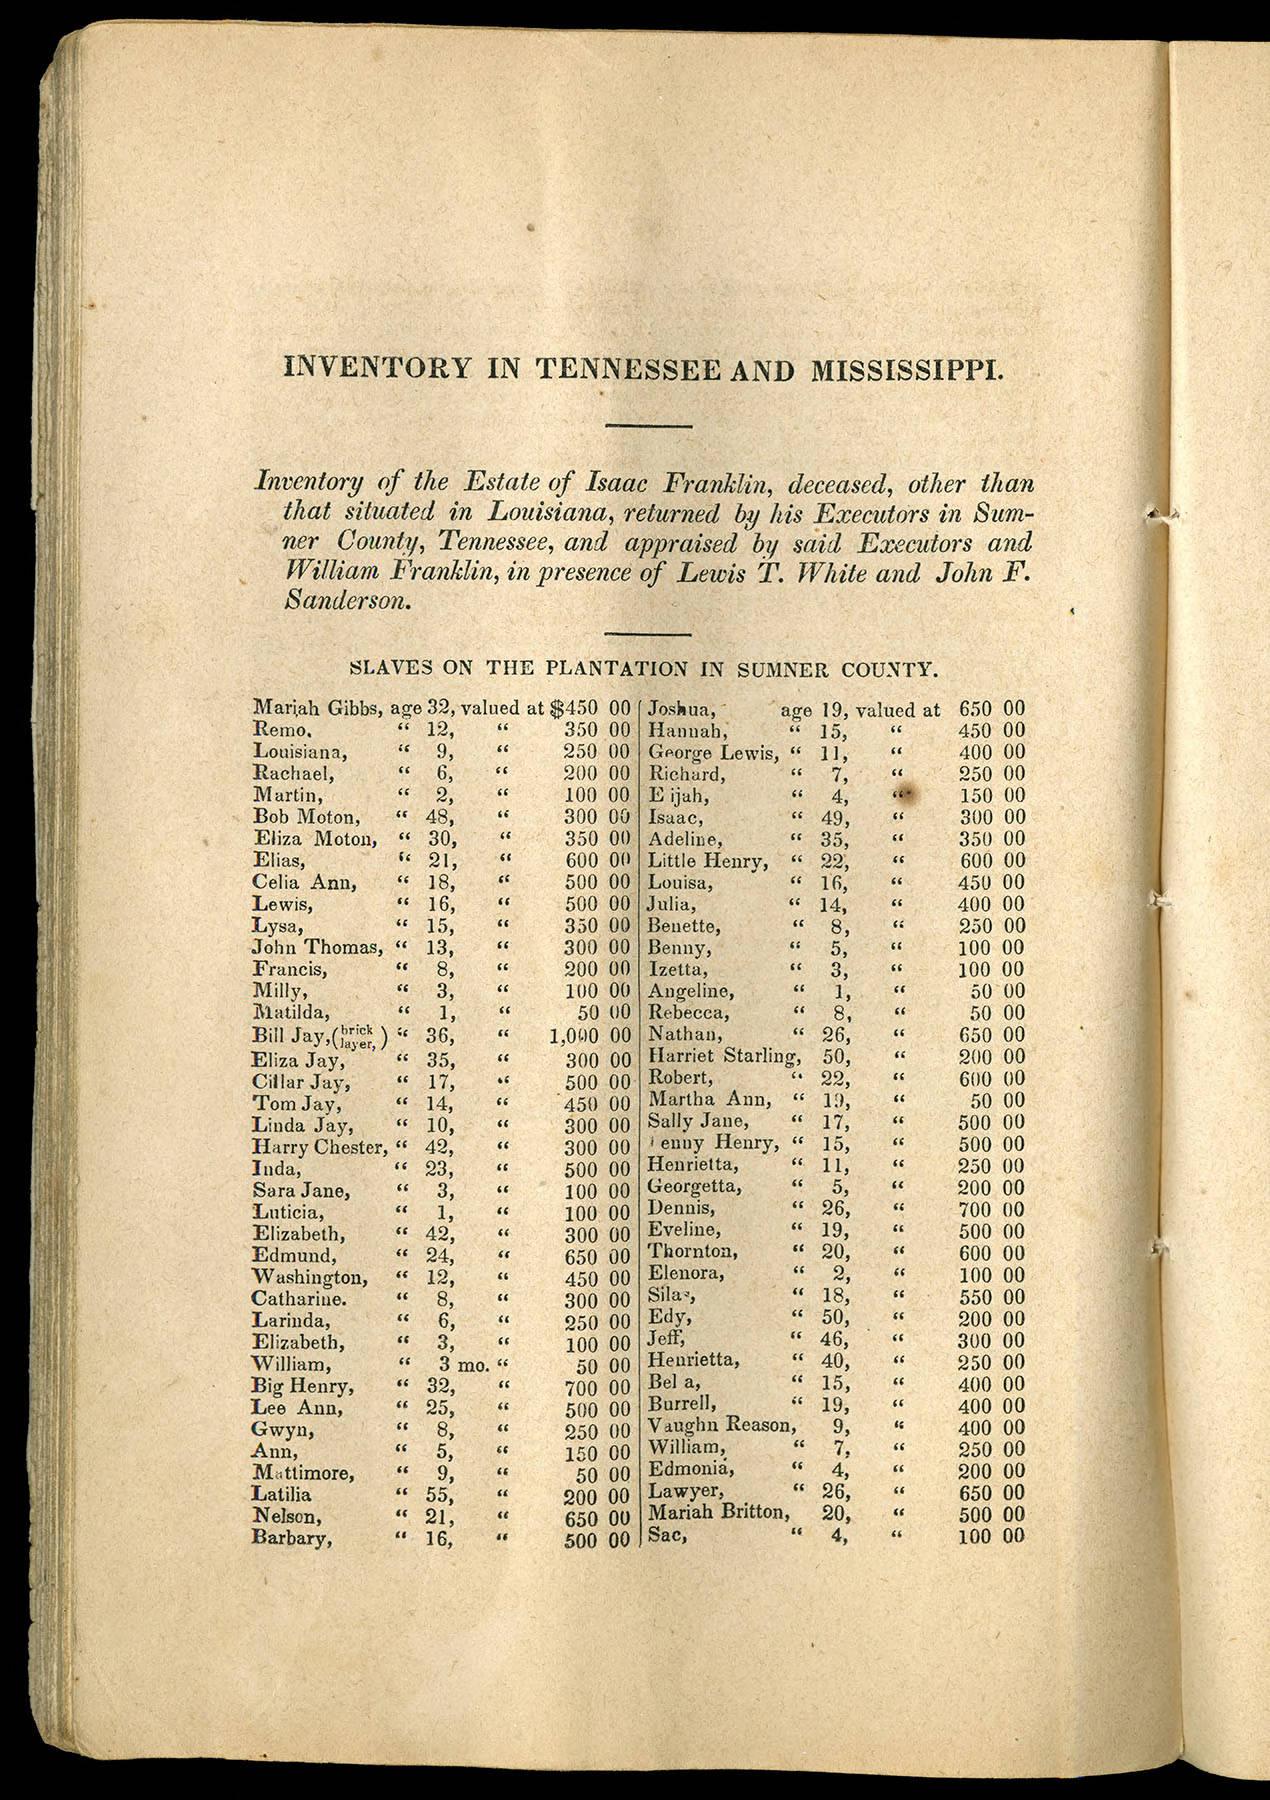
- This is the inventory of the estate of an enslaver in the United States. Create a dataset for the first six entries from the document. Also add “Bill Jay” and “William,” both of whom are further down the list of enslaved people: https://teva.contentdm.oclc.org/digital/collection/p15138coll18/id/1490/ . Or see this file:
- Open Excel on your laptop.
- This is a registry of how the cause of death of people in Fairfax County, Virginia, in the United States. [Citation: Fairfax County (Virginia) Register of Deaths, Fairfax Circuit Court Historical Records Center, Fairfax VA.] Begin a dataset for of the enslaved people. Begin on line 10 with Petter Settle and enter five lines (lines 10 Peter Suttle, 11 Jinny, 12 unnamed, 13 Aaron, and 14 unnamed) :
- Open Excel on your laptop.
- This collection consists of seventeen Certificates of Residence. Under the provisions of the 1892 Geary Act, which amended the Chinese Exclusion Act of 1882, all Chinese in the United States were required to apply for, obtain, and carry a government-issued certificate of residence proving their legal presence in the United States. Chinese and Chinese Americans discovered without such identification could be arrested and deported. Create a dataset from the first three (or more) documents on this site: https://digitallibrary.californiahistoricalsociety.org/object/2625?solr_nav%5Bid%5D=0153503c8613a8d43d58&solr_nav%5Bpage%5D=0&solr_nav%5Boffset%5D=0 . Or see files here:
- Add the first four documents from this site: https://www.archives.gov/san-francisco/highlights/residence
- Open a new window in Excel.
- A page from the inventory of the Hallhead Estate in Jamaica is available here.
- If anyone from this class is excited about this material, there is a wealth of it. This would make for an excellent international team study that we could seek publication for. See: https://oac.cdlib.org/findaid/ark:/13030/tf4k4006vg/dsc/#ref376
- If you want to join a team to create and analyze a dataset, send a request to join here: https://docs.google.com/spreadsheets/d/1QtFacXknrB1AfV3_bqqoqO8u7gUnUoXUwkMuyn76SMw/edit?usp=sharing
Exercise for Day 4: Update your Datasets Considering Best Practices
- Revisit the two datasets from yesterday and add fields and change things to conform with best practices. In other words, pay attention to what is listed in these controlled vocabulary and metadata files. Use the datasets you made yesterday or download these Excel files and edit them:
- Franklin Estate Inventory: https://dhworkshop.org/wp-content/uploads/2025/06/franklin-excel-demo-for-upload-excel-copy.xlsx
- Fairfax County Deaths: https://dhworkshop.org/wp-content/uploads/2025/06/fairfax-deaths-for-upload.xlsx
- This collection consists of seventeen Certificates of Residence. Under the provisions of the 1892 Geary Act, which amended the Chinese Exclusion Act of 1882, all Chinese in the United States were required to apply for, obtain, and carry a government-issued certificate of residence proving their legal presence in the United States. Chinese and Chinese Americans discovered without such identification could be arrested and deported. Based on best practices, how would you create a dataset from the first three (or more) documents on this site:
- https://digitallibrary.californiahistoricalsociety.org/object/2625?solr_nav%5Bid%5D=0153503c8613a8d43d58&solr_nav%5Bpage%5D=0&solr_nav%5Boffset%5D=0 .
- Or see files here:
- Or see files here:
- Add the first four documents from this site: https://www.archives.gov/san-francisco/highlights/residence
- https://digitallibrary.californiahistoricalsociety.org/object/2625?solr_nav%5Bid%5D=0153503c8613a8d43d58&solr_nav%5Bpage%5D=0&solr_nav%5Boffset%5D=0 .
Exercise for Day 5: Flourish, GraphCommons, and Artificial Intelligence
- Open ChaptGPT, NotebookLM, or whatever AI model you use.
- Upload this dataset:
- Ask the AI for:
- The percentage of males and females in the dataset
- The average age of people in the dataset
- The average value of males and average value of females in the dataset
- The percentage of enslaved people who are 0-1 years old, 2-9 years old, 10-19 years old, 20-29 years old, 30-39 years old, 40-49 years old, 50-59 years old, 60-69 years old, 70-79 years old, and 80-89 years old.
- Upload these primary source:
- Ask the AI to transcribe them and then to put the data from it into a spreadsheet.
- Open an account in GraphCommons, which is a free data visualization website, ideal for digital social network demonstrations.
- https://graphcommons.com/
- GraphCommons PowerPoint. Note that the PowerPoint begin after the Flourish PowerPoint.
- Examples of a Graph Commons Project:
- http://networkingtherevolution.org/
- Download this Excel file. Upload it to GraphCommons. Let’s manipulate it in class.
- Open an account in Flourish, which is a free data visualization website, ideal for digital map making:
- https://flourish.studio/
- Flourish user guide for mapping
- Flourish PowerPoint
- Example of a Flourish project:
- For the exercise, upload this datafile and make a map of the world that indicates the world’s capitals. Note
- you MUST convert the file from .xls to .csv (comma separated values). This website does not allow for the upload of .csv files but converting is easy.
- the file: https://dhworkshop.org/wp-content/uploads/2025/06/concap-2.xlsx
